During the Persian Gulf War in 1991 Iraqi military forces released large amounts of crude oil into the Persian Gulf affecting nearly 400 miles of coastline in Saudi Arabia and Kuwait. This study focuses on distribution of a major oil slick in Ad Daffi Bay on March 4th 1991. Landsat Thematic Mapper bands of 30 meter pixel size are used to identify the spatial distribution and quantify the amount of oil contaminating Ad Daffi Bay. Thematic Mapper bands 4 and 5 (TM4 and TM5) in the near and mid infrared provided distinct spectral signatures for oil, land, and water. Using a mask of band 4 and density slice of band 5 a thematic map is created showing primary distribution in the north east of the bay and along the eastern shores. A rough estimate of approximately 500 hectares of oil spilled is the best this approach can achieve without higher spatial resolution or statistical definitions of density slice ranges. Analysis carried out using the software package ENVI.
 Figure 1. False color image of Ad Daffi Bay with TM5 symbolized in red to show contrast between oil and water. Red represents reflectance in the mid-infrared, which is only weakly reflected by water and is strongly reflected by oil.
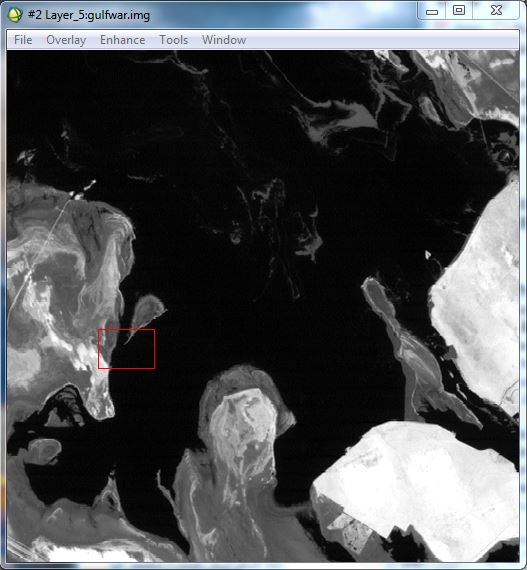
Figure 2. TM5 in grayscale shows the distinction in reflectance values between oil, which appears lighter gray, and water, which appears black. Oil appears primarily in the north east part of the map area.

Figure 3. The distributions of reflectance values in TM5. The x-axis “data value” is reflectance and the y-axis is the number of pixels with that value. Low reflectance values correspond to the darker areas of Figure 3, and higher reflectance values are the lighter areas. Peaks from left to right represent water, oil, and land. The designation of peaks is corroborated by the point values in each peak that correspond to water, land, and oil in Figure 1.

Figure 5. Mask covering land in Ad Daffi Bay, Persian Gulf. The mask is based on reflectance values in TM4 which is useful for differentiates land from water. 0 Values are black and correspond to land. Values of 1 are white and correspond to water and oil.

Figure 6. Masked and reclassified density slice classification of Ad Daffi Bay, Persian Gulf. Density slice based on the distribution of values in Figure 3, and the mask in Figure 5. Green areas represent land, blue represents water, yellow represents light oil, and red represents heavy oil. Larger areas in the southern portion of the map are green now after using the mask.
Full Report: Reedy_Lab
