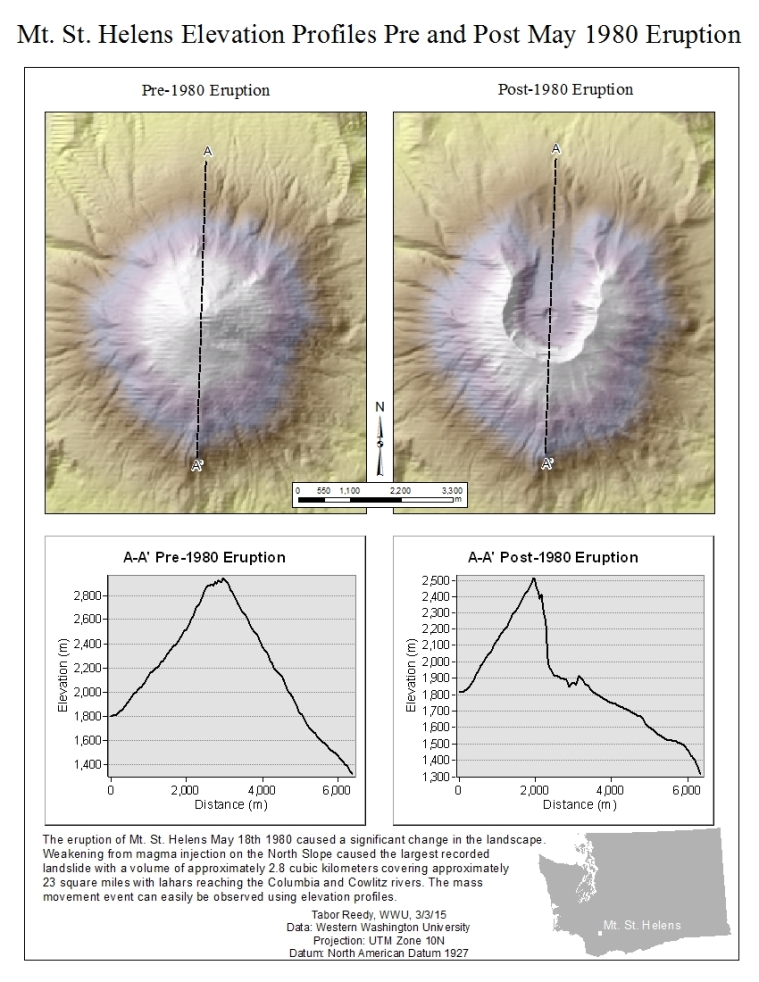
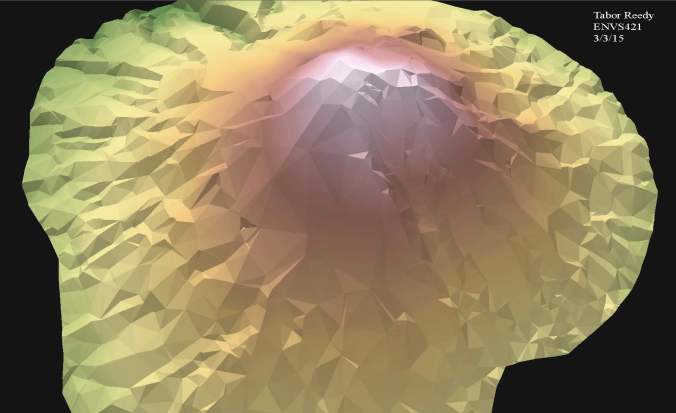
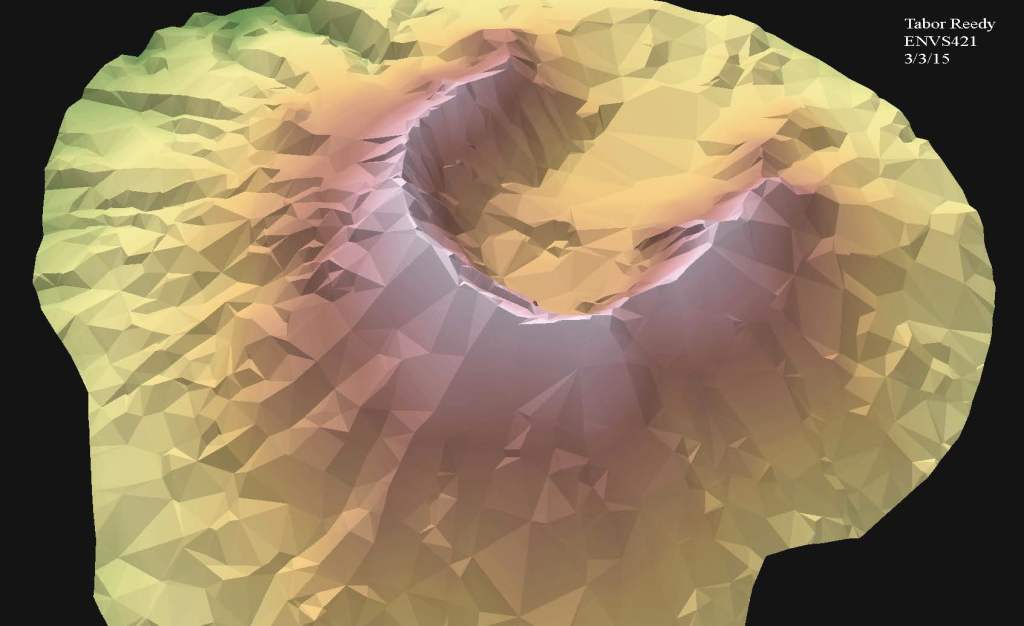
In this project I used the 3D analyst tool in ArcGIS to analyze the change in Mt. St. Helens after the May 1980 eruption. I first display the the landscape using a hillshade and color ramp in ArcMap (Fig. 1). Then the raster Digital elevation model is converted to a triangular irregular network (TIN) and moved to ArcScene where a volumetric analysis is carried out. The 3D visualization in figures 2 and 3 are created with a 1.5x vertical exaggeration.
Finally we used ESRI’s Tracking Analyst Extension to visualize a temporal dataset of Atlantic Hurricane paths. I created an animation of hurricane paths and wind speed over land. Anywhere that wind speed is over 75 mph over land the point is highlighted.
Figure 1. Change in profile of Mt. St. Helens after the May 1980 eruption.
Figure 2. TIN of Mt. St. Helens before the May 1980 eruption.
Figure 3. TIN of Mt. St. Helens post May 1980 eruption.
My apologies, the temporal animation in processing for use in youtube, had some kind of error causing the colors to change and the text to be hard to read. You can still get the general idea though. Temporal animation: https://www.youtube.com/watch?v=dZQJIifmK8M
PDF VERSIONS


