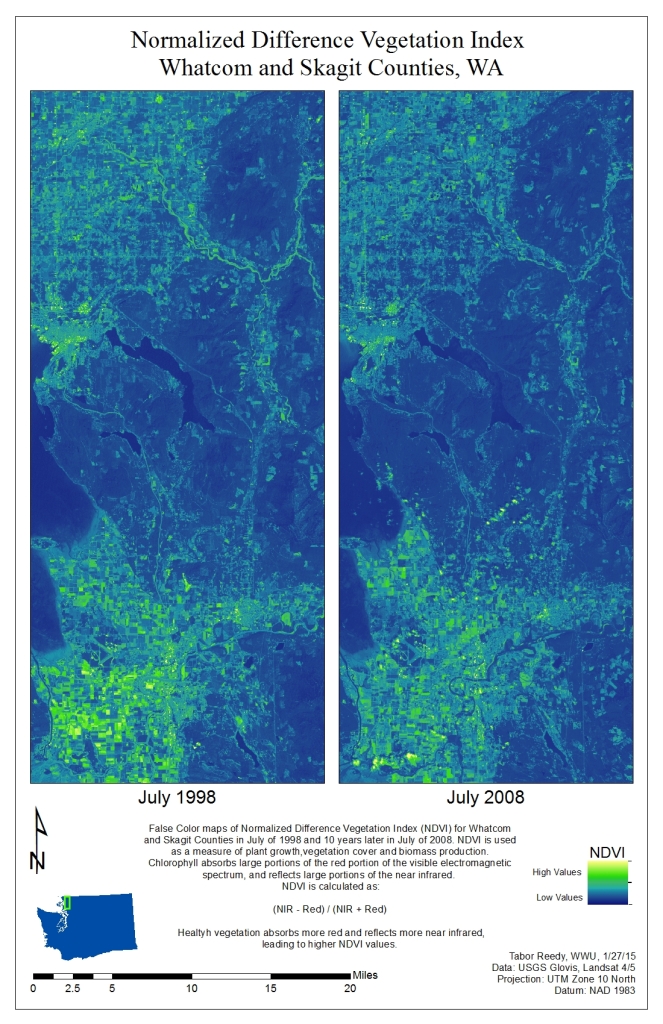
The goal of this lab is to gain a basic understanding of Remote sensing data, especially data collected Landsat satellite imagery, and do some basic calculations in ArcMap with this imagery. After exploring some of the display options and combinations of Thematic bands, we used the Normalized Difference Vegetation Index (NDIVI) to quantify the growth and of biomass in the Landsat Image that covers mostly Whatcom and Northern Skagit Counties (Fig. 1).
NDVI: (Near Infrared – Red) / (Near Infrared + Red)
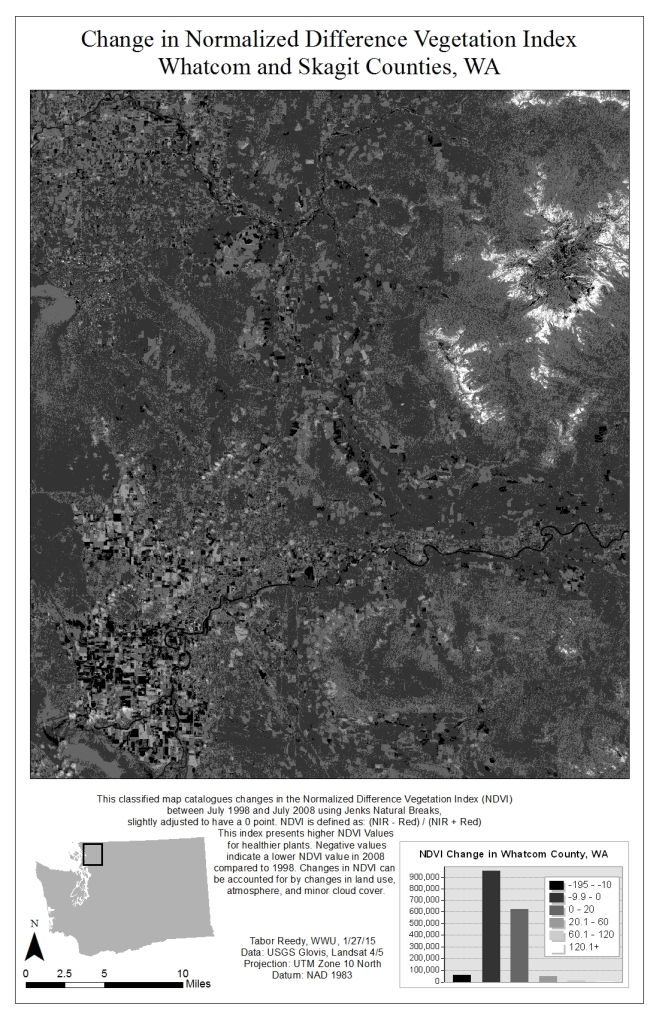
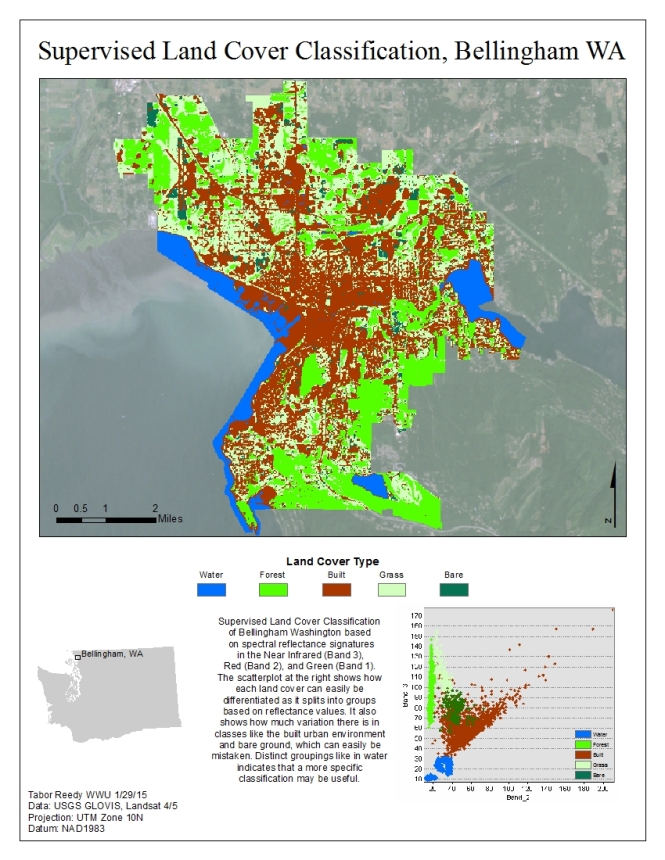
Healthy vegetation reflects more infrared and absorbs more red, older or sometimes less healthy vegetation reflects relatively more red. Thus higher NDVI values correspond to healthy vegetation. Calculating NDVI for two different time periods, in this case July 1998 and 2008, allows for a change over time estimation (Fig. 2). Land use change, atmosphere, and clouds can affect individual locations, but the trend as a whole can be interpreted. Finally we use training sites identified in the image to carry out a supervised classification of Bellingham and asses the results.
 Figure 1. Normalized Difference Vegetation Index for Whatcom and Skagit Counties in July of 1998 and 2008.
Figure 2. Change in NDVI for Whatcom and Skagit Counties between July 1998 and 2008. Classified by Jenks Natural Breaks, but with an adjust bin to create a zero point. Changes are not solely vegetation changes, considering the effect of the atmosphere, clouds, and changes in land use.
Figure 3. Supervized classification of Whatcom County based on spectral reflection values in the Near Infrared (TM band 4), Red (TM Band 3), and Green (TM band 2).
Higher resolution PDF versions:

